
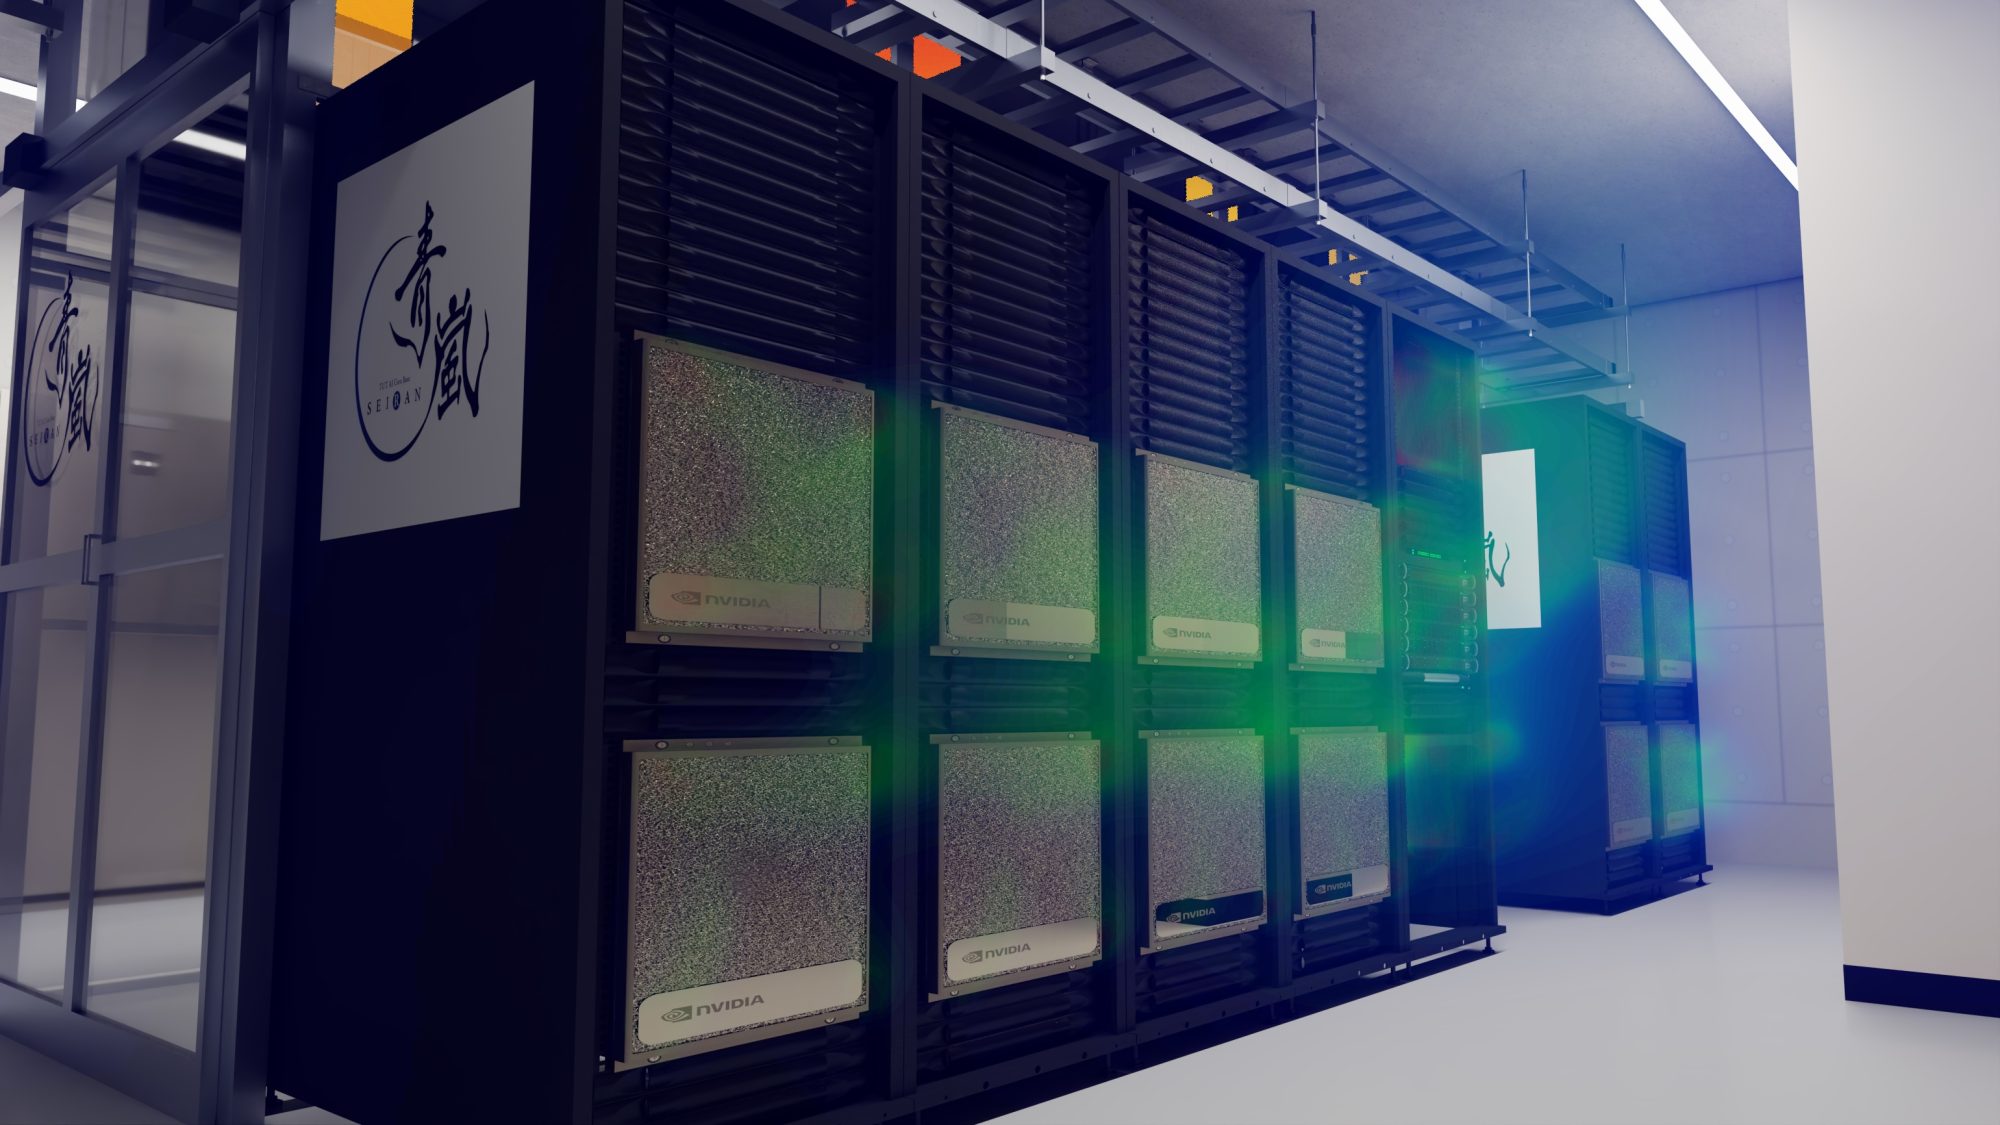
CFD is a powerful way to understand temperature and airflow distributions inside a data center.
However, CFD simulations can take a long time. Re-running the simulation every time the server load or air-conditioning conditions change is therefore not suitable for a real-time digital twin.
To address this issue, we developed a system that builds an AI surrogate model from Ansys Fluent CFD results and visualizes the predicted results at high speed in NVIDIA Omniverse Kit-CAE.
The overall workflow is:
Ansys Fluent
↓
CFD Dataset
↓
PCA
↓
PCA Coefficient Prediction with MLP
↓
Temperature and Velocity Field Prediction
↓
Fast Voxel Generation
↓
NanoVDB
↓
Kit-CAE / NVIDIA IndeX
↓
Omniverse Visualization
1. Building the Surrogate Model
The target model is a data center with multiple server racks and four air-conditioning units.
The surrogate model takes five inputs:
- GPU load ratio
- AC1 to AC4 ON/OFF states
CFD simulations were performed under multiple operating conditions, resulting in a dataset of 200 cases.
The CFD mesh is shared across all cases and contains approximately 1.87 million fluid cells.
The following quantities were extracted from each case:
- Temperature
- Velocity U
- Velocity V
- Velocity W
2. Dimensionality Reduction with PCA
Directly predicting physical values for approximately 1.87 million cells would make the neural network output extremely large.
Therefore, PCA was used for dimensionality reduction.
For example, the Temperature field was compressed from:
approximately 1.87 million dimensions → 21 dimensions
Velocity U, V, and W were represented using 20 components each.
Instead of constructing a huge covariance matrix of approximately 1.87 million × 1.87 million, we used a 139 × 139 Gram matrix based on the number of training cases and performed eigendecomposition on the GPU.
This made it possible to apply PCA efficiently to large-scale CFD data.
3. Inference with an MLP
After PCA compression, an MLP was trained to predict PCA coefficients from the GPU load ratio and AC operating states.
The basic structure is:
Input 5
↓
Linear 64
↓
Tanh
↓
Linear 64
↓
Tanh
↓
Output 20 or 21
The network is small, so inference is very fast.
The 200 cases were divided into:
- Training: 139
- Validation: 31
- Test: 30
Representative prediction accuracy was:
- Temperature MAE: approximately 0.45 K
- Velocity MAE: approximately 0.14 m/s
Although larger errors can remain around local peaks, the overall temperature and airflow trends are reproduced reasonably well.
Visualization Became the Bottleneck
The surrogate model made CFD prediction much faster.
However, the initial Omniverse visualization pipeline still required:
Inference
↓
Save NPZ
↓
VTK Interpolation
↓
OpenVDB Generation
↓
Save VDB
↓
Omniverse Visualization
Representative processing times were:
| Process | Time |
|---|---|
| Inference + NPZ output | approximately 2.15 s |
| OpenVDB conversion | approximately 8.47 s |
| Total | approximately 11.11 s |
In other words, visualization data generation became more expensive than AI inference itself.
High-Speed Visualization with Kit-CAE
To solve this problem, the visualization pipeline was redesigned around Kit-CAE.
The new pipeline is:
PyTorch Inference
↓
Shared Memory
↓
Fast Voxel Generation
↓
Warp CUDA
↓
NanoVDB
↓
SimData
↓
CaeViz
↓
NVIDIA IndeX
The main changes were:
- Removed per-case NPZ output
- Removed OpenVDB file generation
- Added inter-process communication using Shared Memory
- Generated NanoVDB directly on the GPU
- Used Kit-CAE SimData, CaeViz, and NVIDIA IndeX
This significantly reduced file I/O.
4. Accelerating Voxel Generation with an Affine Cache
Another major optimization was eliminating repeated VTK interpolation.
Previously, the pipeline was:
PCA Coefficients
↓
Reconstruct Temperature for approximately 1.87 million cells
↓
Interpolate to Voxel Grid with VTK
However, PCA reconstruction and interpolation from a fixed mesh to a fixed voxel grid are both linear operations.
Therefore, the PCA basis itself was interpolated into voxel space in advance and stored as an affine cache.
At runtime, only:
PCA Coefficients
↓
Matrix Multiplication with Voxelized PCA Basis
↓
Voxel Temperature Field
is required.
5. Benchmark Results
For voxel generation:
- Conventional VTK interpolation: 13.080 s
- Affine cache: 0.410 s
This resulted in approximately 31.9× faster voxel generation.
The temperature differences between the two methods were extremely small, meaning the accelerated method produced almost the same result.
Representative steady-state processing times are:
| Process | Time |
|---|---|
| GPU surrogate inference | approximately 0.009 s |
| Affine voxel generation | approximately 0.224 s |
| NanoVDB generation | approximately 0.041 s |
| Total | approximately 0.274 s |
This 0.274 s does not include all viewport rendering and Kit-CAE update time.
Why Kit-CAE?
Standard USD Composer can also visualize OpenVDB data.
However, the important requirement in this project was:
to visualize CAE data directly from memory rather than loading it from files.
Kit-CAE provides Dataset, Field, and Visualization Operator concepts, allowing GPU-resident NanoVDB data to be handled through SimData and rendered with NVIDIA IndeX.
This makes Kit-CAE well suited for a system where prediction results are updated repeatedly.
Future Features
The current implementation mainly focuses on high-speed Temperature Volume visualization.
In the future, the same surrogate model will also predict the Velocity field, and both Temperature and Velocity will be handled within the same Extension.
This will allow multiple CFD visualization methods to be implemented in the same Extension, including:
- Volume visualization
- Streamlines
- Planar slices
- Velocity vectors
The goal is to create a digital twin that can show not only where hot regions occur, but also how airflow contributes to those thermal conditions.
Toward a Data Center Monitoring Dashboard
In addition to 3D visualization, the system will be extended to display metrics such as:
- Maximum Temperature
- Average Temperature
- Rack Inlet Temperature
- Rack Outlet Temperature
- CRAC Supply Temperature
- CRAC Return Temperature
Cooling efficiency indicators such as RTI will also be calculated, and warnings will be displayed when values exceed defined thresholds.
This will allow the data center thermal condition to be monitored in near real time.
Conclusion
In this project, we built a surrogate model from Ansys Fluent CFD results and developed a high-speed visualization system in NVIDIA Omniverse Kit-CAE.
The main points are:
- Approximately 1.87 million CFD cells compressed to about 20 PCA components
- PCA coefficients predicted with a small MLP
- Large-scale PCA accelerated using a Gram matrix approach
- Temperature MAE of approximately 0.45 K
- OpenVDB file-based processing removed
- Shared Memory and NanoVDB introduced
- Voxel generation accelerated by approximately 31.9× using an affine cache
The key lesson from this development is:
For a real-time digital twin, accelerating AI inference alone is not enough. The entire pipeline, including visualization, must also be optimized.
The long-term goal is to combine CFD, AI, and Omniverse to monitor the thermal state of a data center in real time and eventually optimize cooling control automatically.